In this video, Carter Banks (BigBankz) walks through a house about to be torn down:
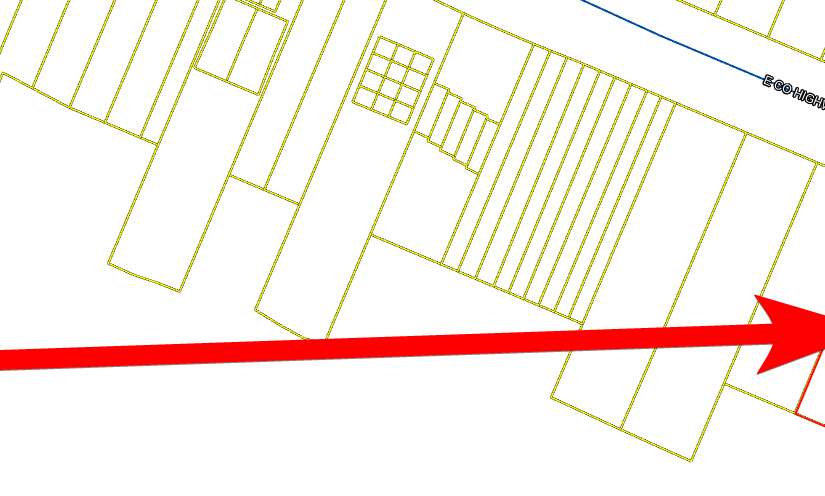
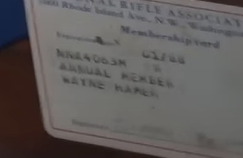
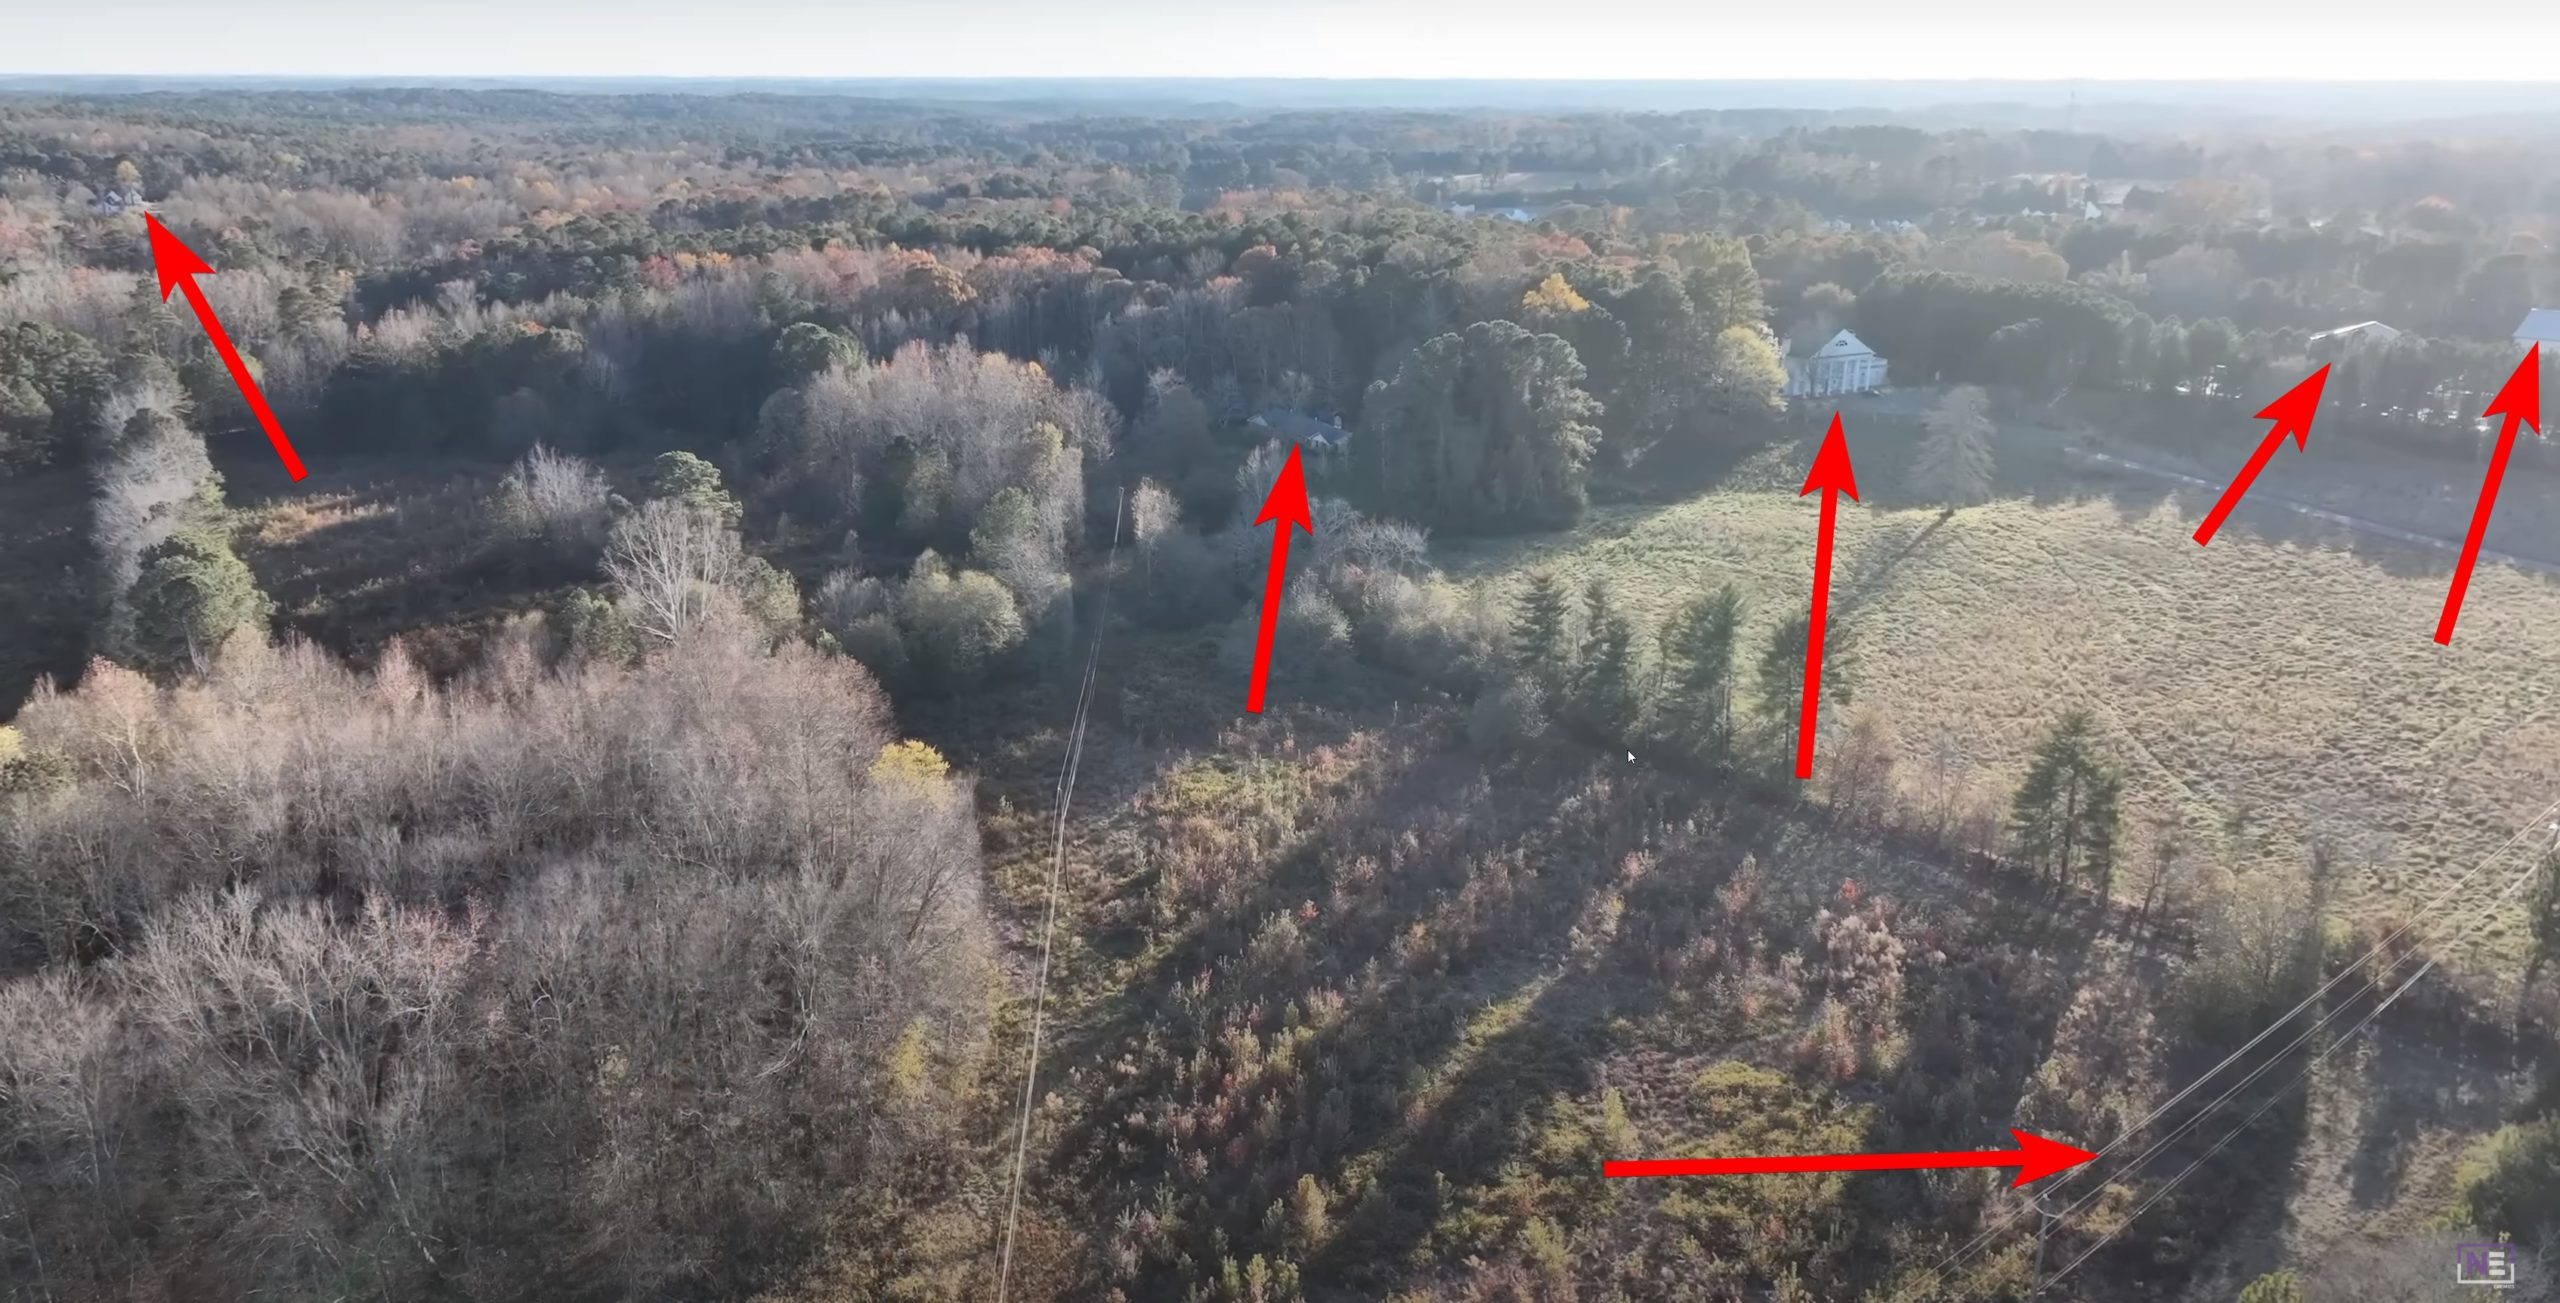
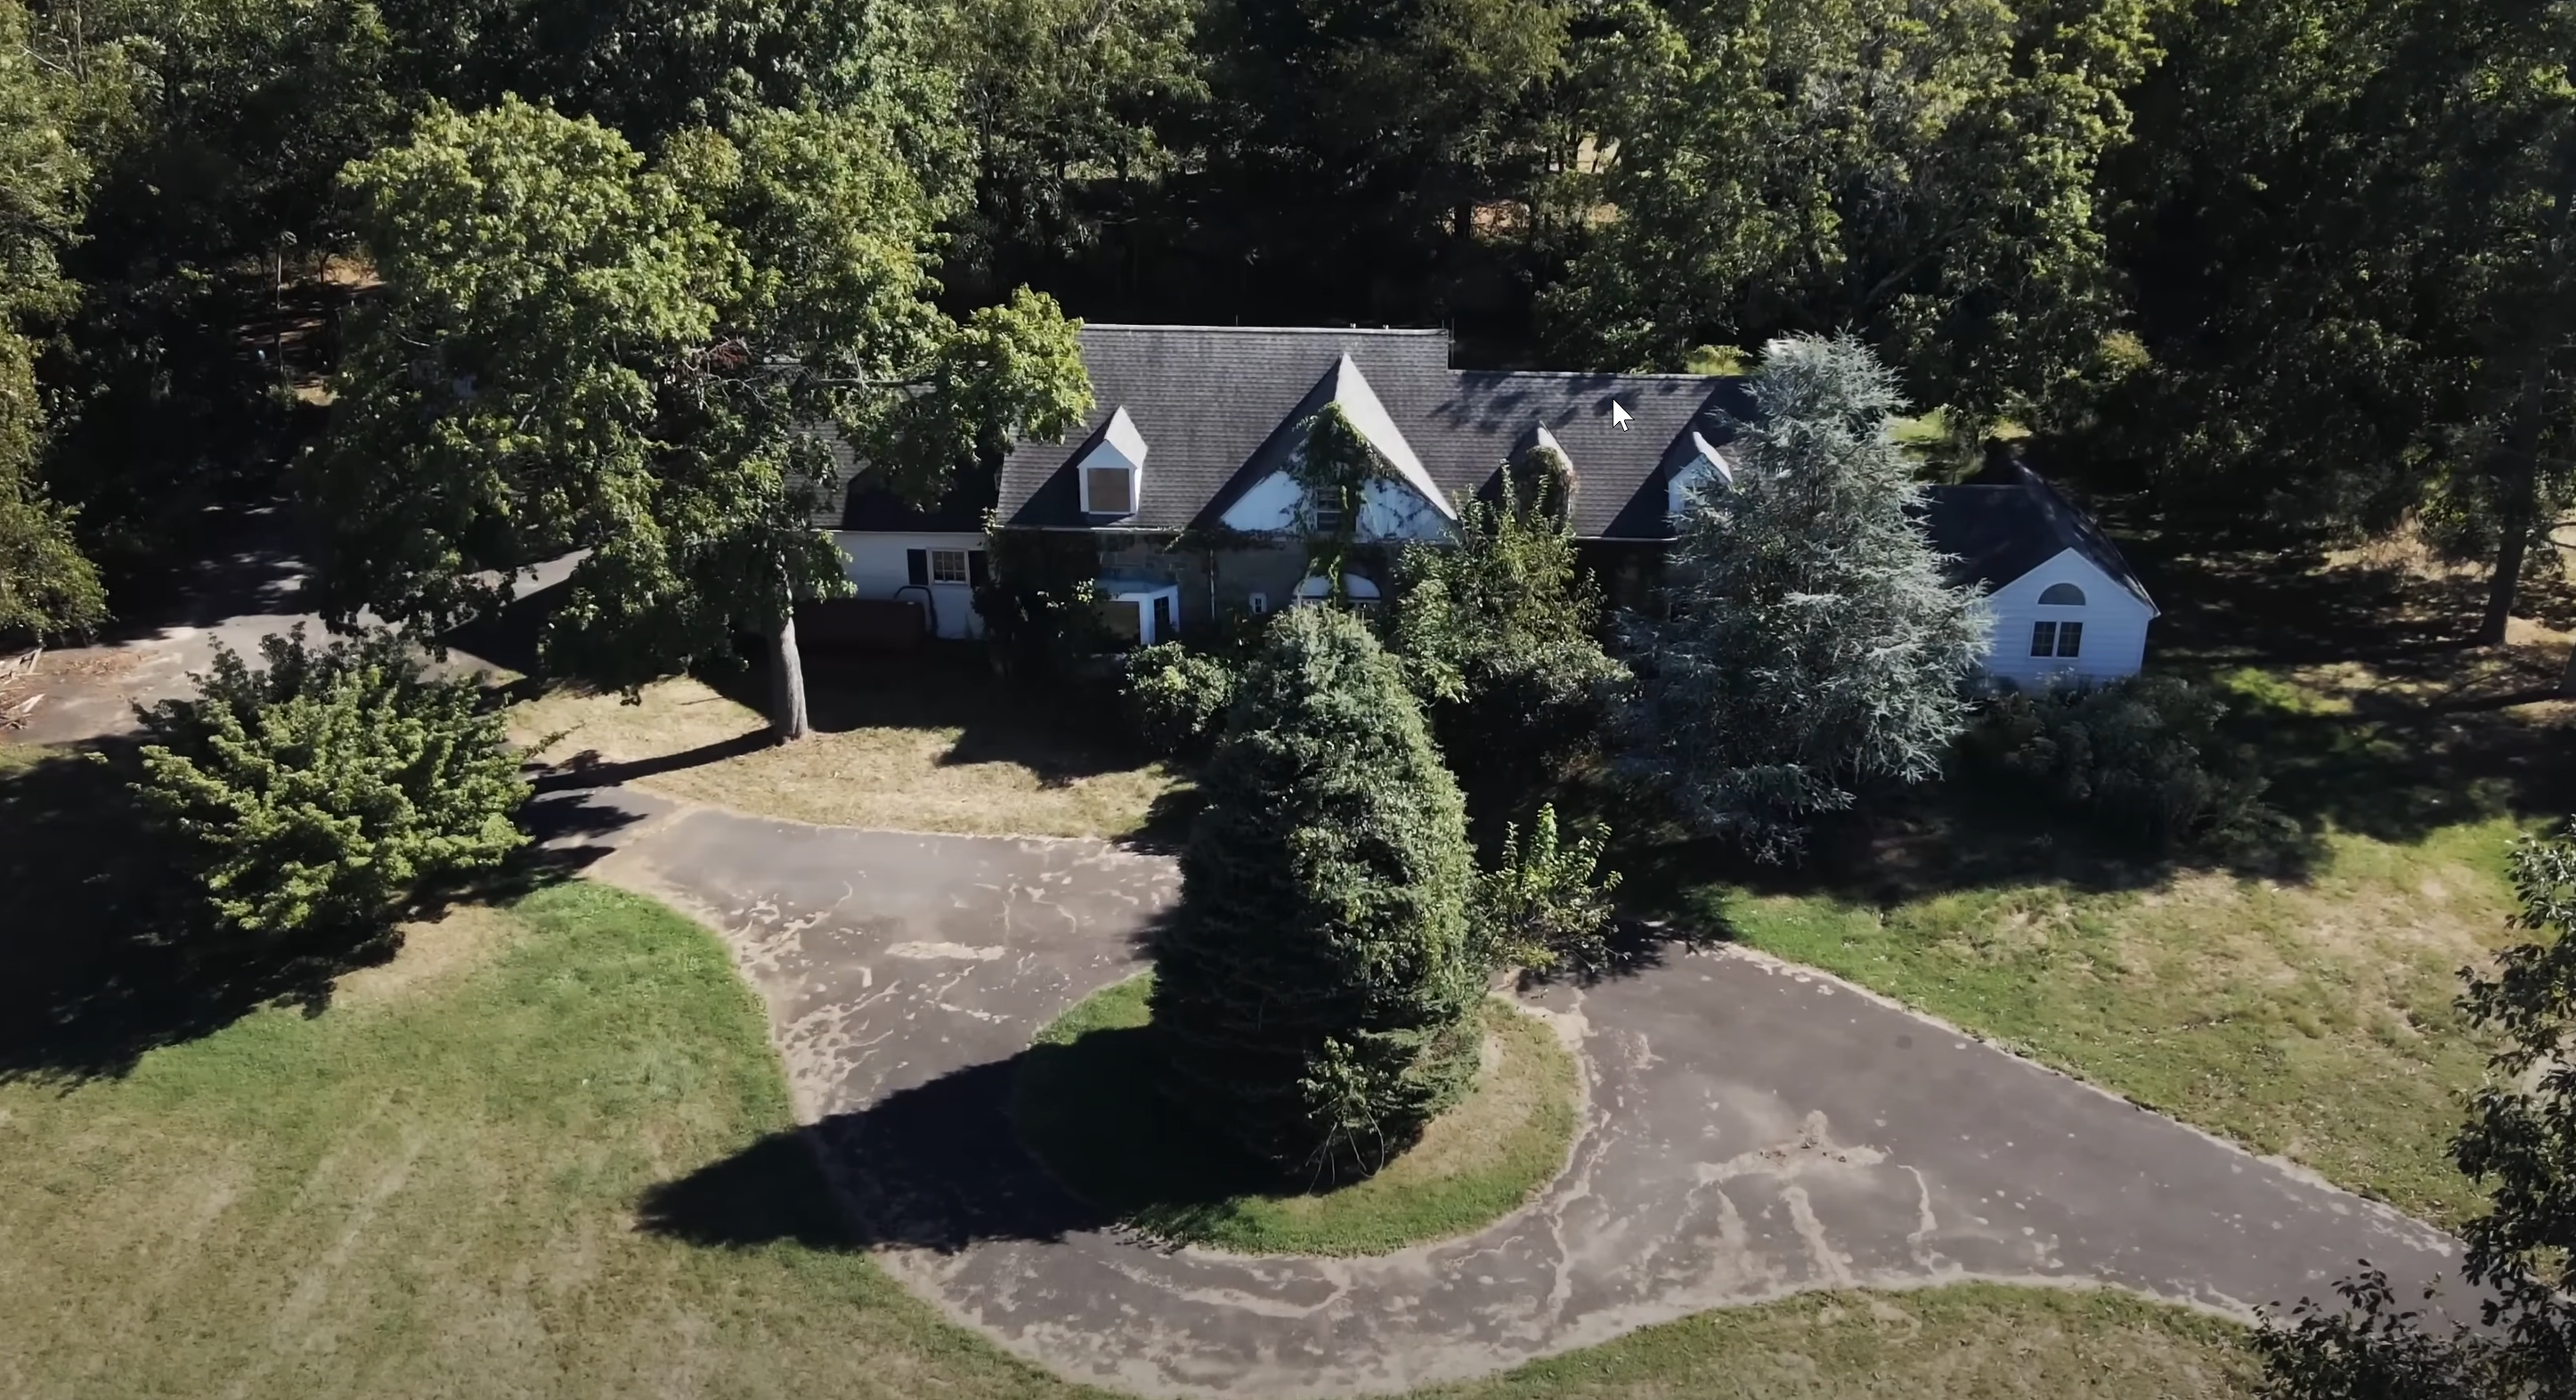
Finding this one wasn’t hard. Early on was a giveaway that this property is in or near Colts Neck, NJ:
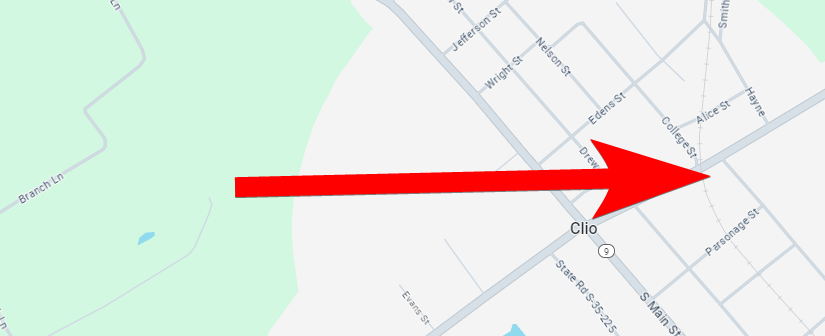
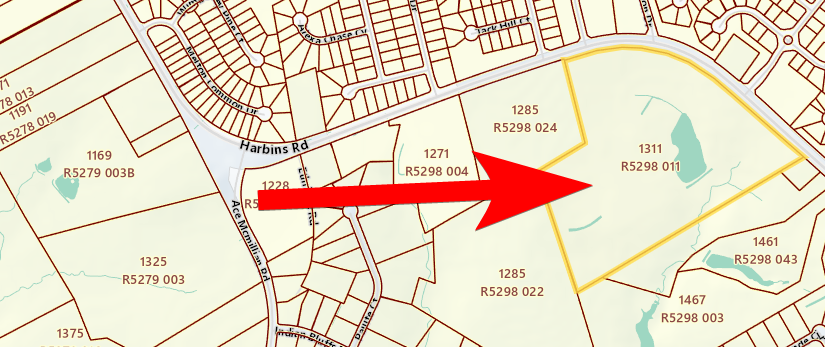
Also, aerial photography gave an aerial fingerprint to search for, especially a driveway that circles around a large tree:
Then some Googling on the back story quickly turned up a story of a July 2018 standoff following a domestic dispute involving James C. Furiato. A James Furiato, with an age that corresponds to this person, seems to be tangling with the law in other instances, such as criminal trespass in Nov. 2015 and defiant trespass while homeless in Feb. 2022. Given this record, a 2018 standoff is not surprising.
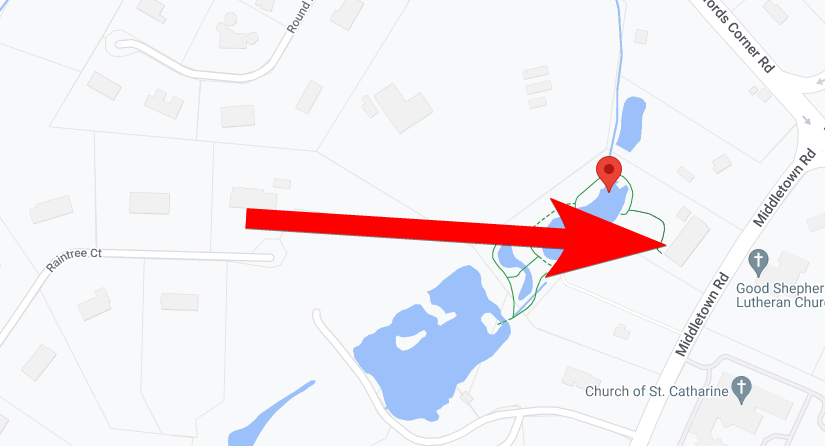
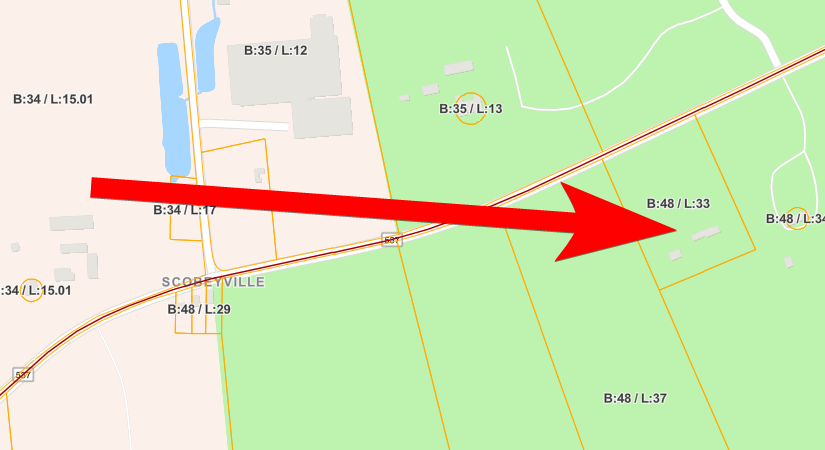
Digging a little more deeply on the raid, we uncover the address of this walkthrough (note: while the house’s legal street number appears to be 350, 208 also shows up in some places, and Google Maps puts both addresses on the same property) :
Now for the back story, it’s considerably different than what Carter claims.
This house was occupied by John and Marie Furiato. Marie is whose medical records you see at one point:
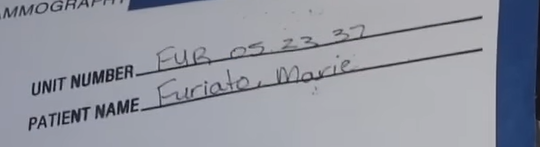
As Marie died in 2015, John continued occupying the house as a widower in 2018.
John and Marie got use of the house thanks to the trust of Marion Huber, who died in 2001. The trust donated the property to the New Jersey Conservation Foundation in 2006 under stipulation that a 2000 agreement be honored that allows John and Marie to occupy the house indefinitely, under certain conditions, like paying taxes, keeping it up, it being their primary residence, and more.
However, an August 2018 lawsuit filed by the foundation against John dished out some dirt (MON-C-000118-18). The suit alleges multiple violations of the 2000 agreement:
- John stopped paying property taxes in 2017.
- In the July 2018 police altercation, James had a “mental breakdown”. “[N]umerous canister [sic] of tear gas” were used to get James out, causing damage that went unrepaired.
- John was hospitalized on the day of the police incident. It defined James as a “squatter”, which suggests John’s hospitalization is associated with a condition that would make him unable to return to the property. (Recall that John’s wife, the other party to the agreement, had already died by 2018.)
- The home is “dilapidated and is otherwise in complete disrepair”.
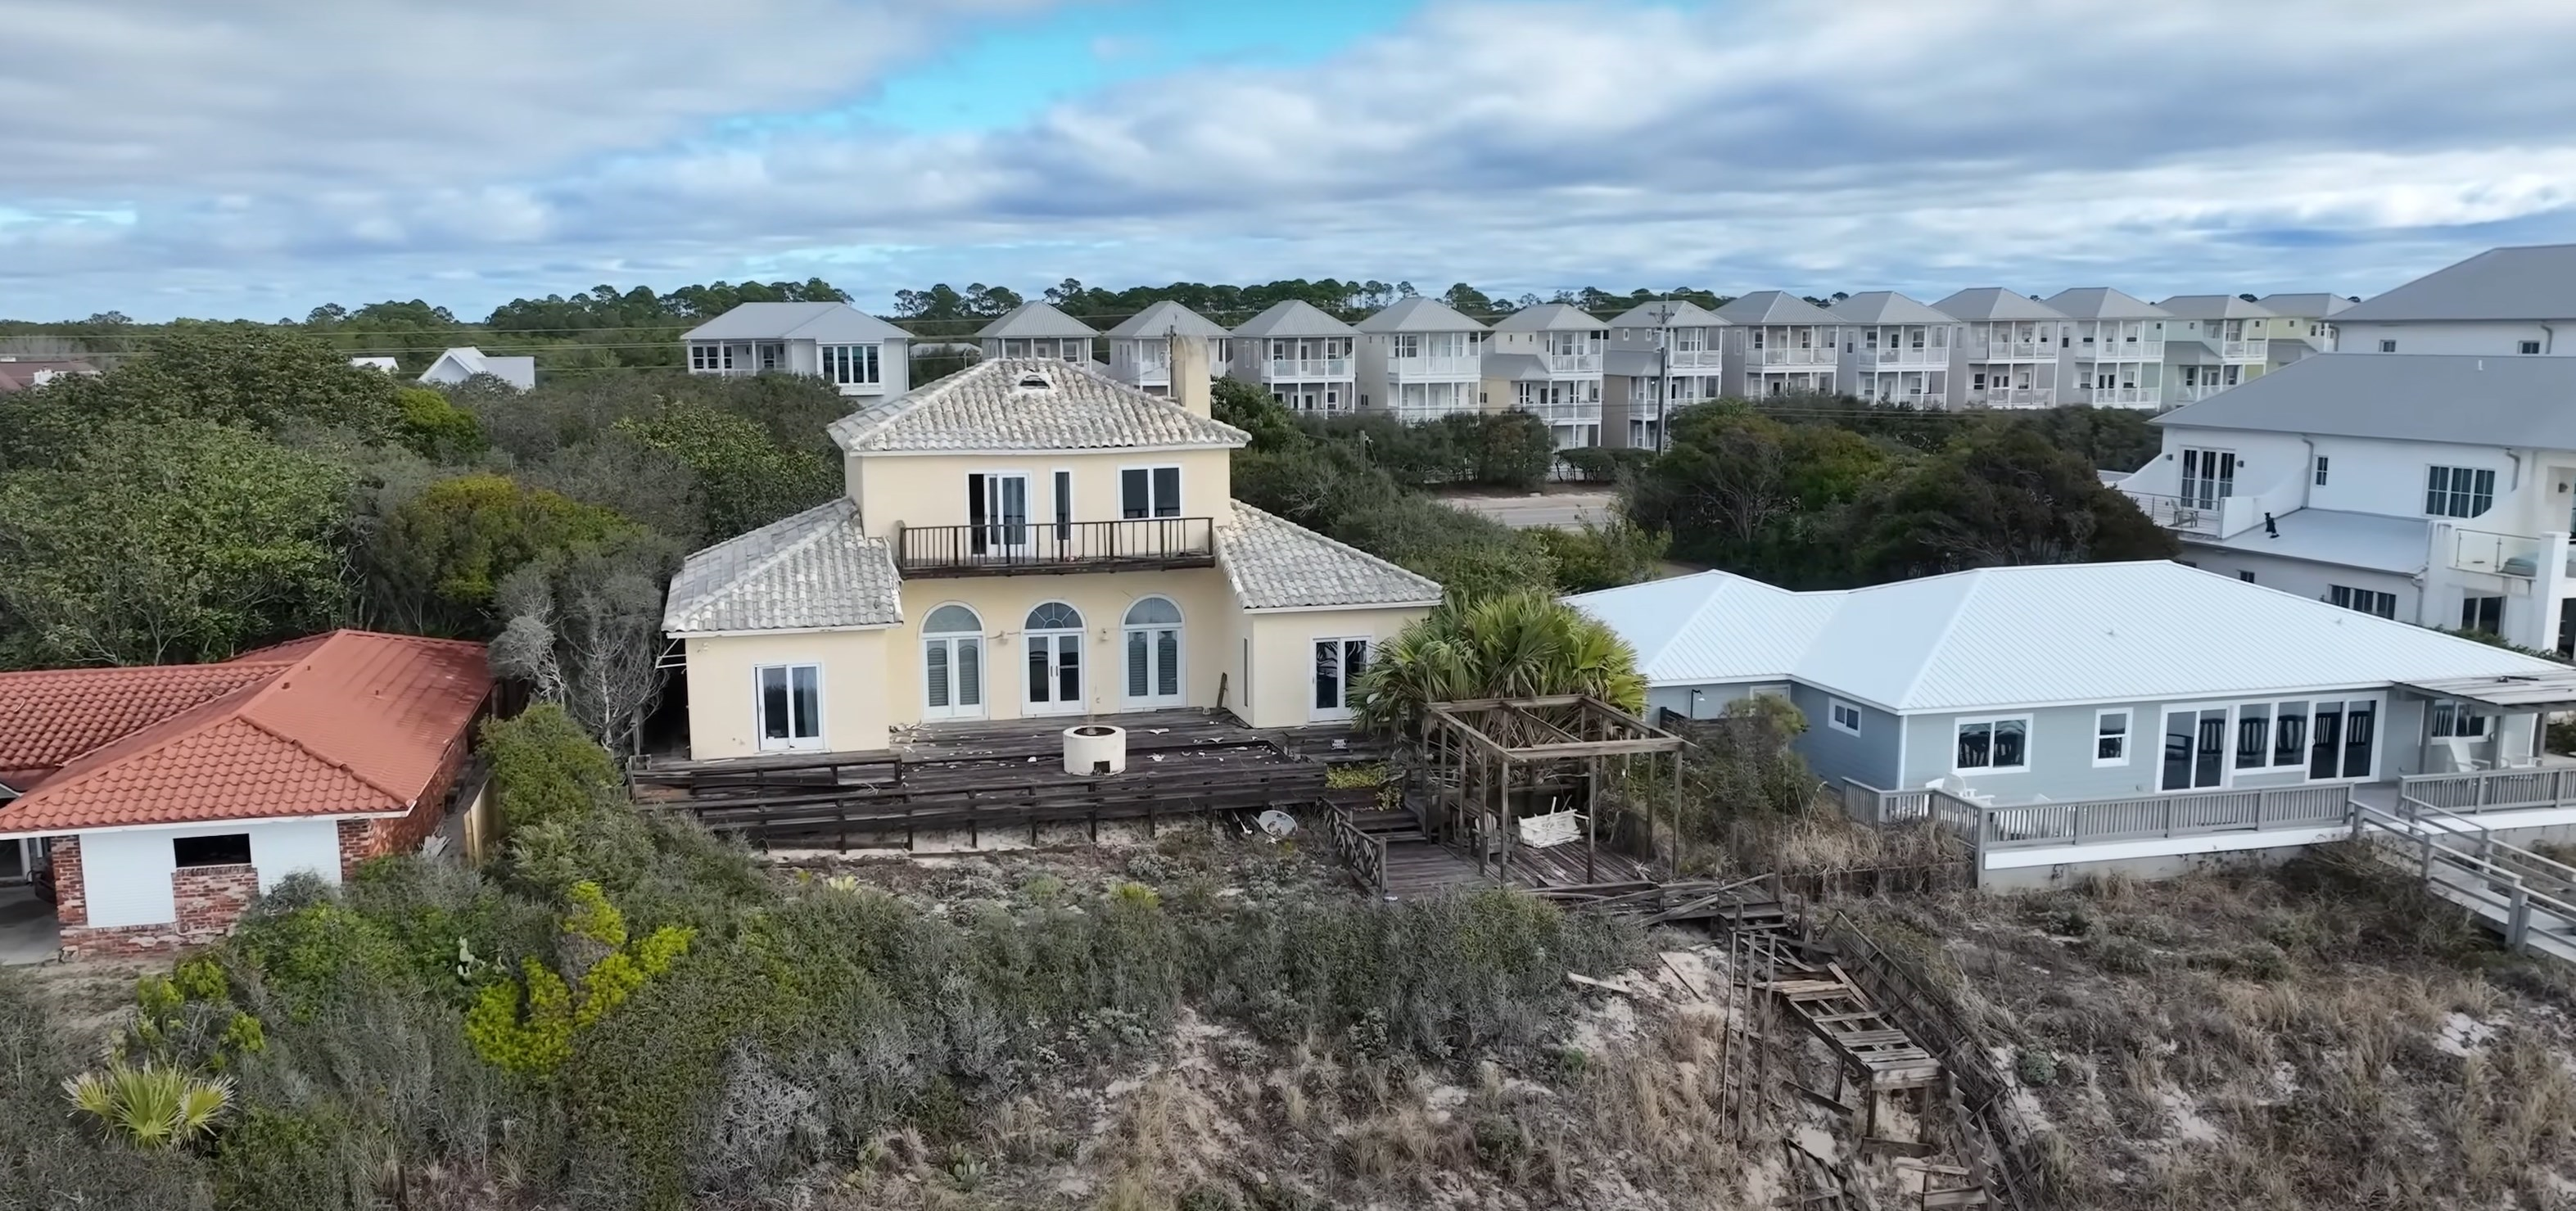
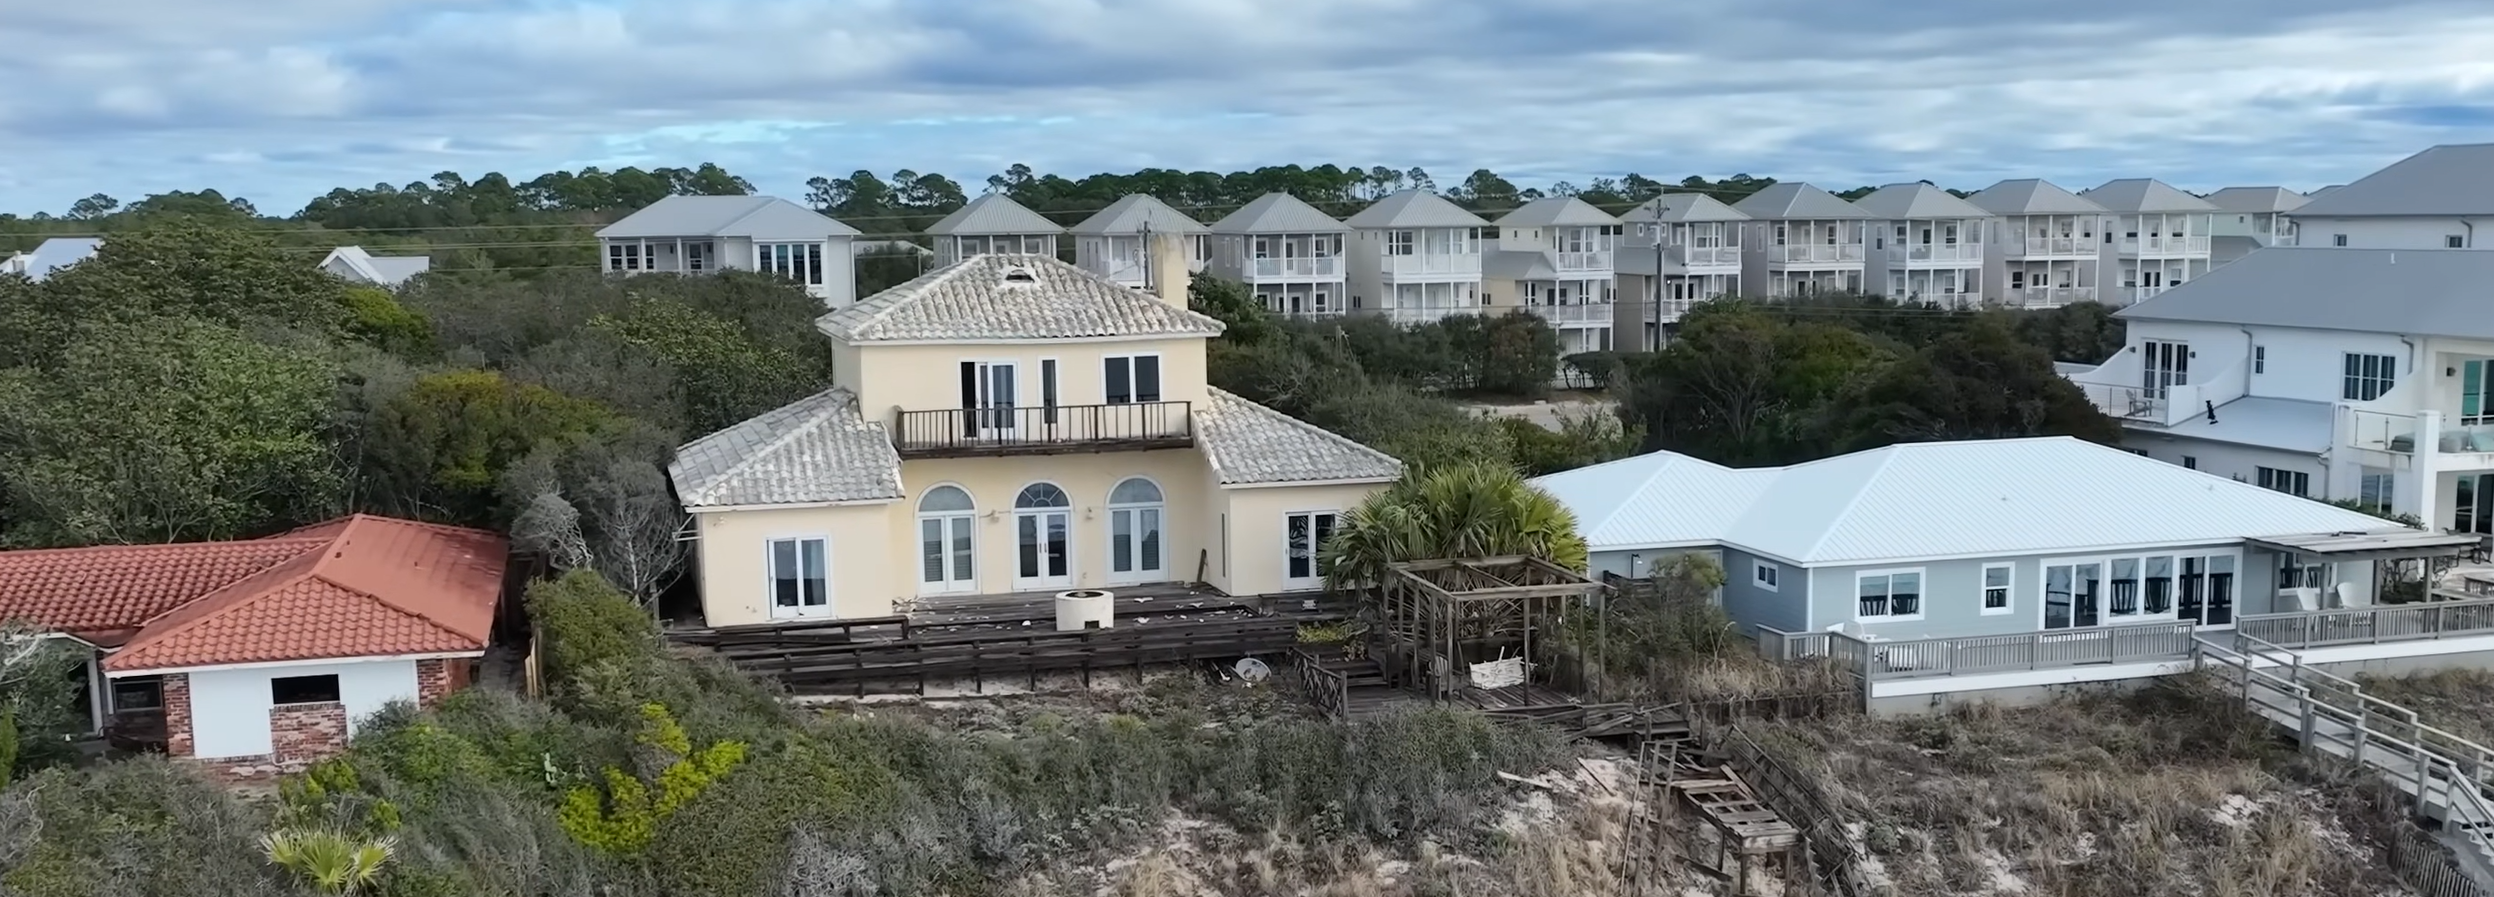
It is also apparent that by August 2018, the month after the incident, boards appeared on the second-floor windows:
In September 2018, the judge terminated John’s interest in the property, and the court gave James specific dates to retrieve property.
Per a Monmouth County press release, the foundation reached an agreement with Monmouth County in 2019 to donate the property for the purpose of building a park; this transfer was transacted in 2020.
The transfer stipulates that the house will be torn down.
Carter uses false information or wild theories to concoct the video title and to craft his narrative:
- “Abandoned”: Nope. The occupants were ejected from the property due to violations of a longstanding agreement, then it was intentionally kept vacant while it is being prepared for a new property use.
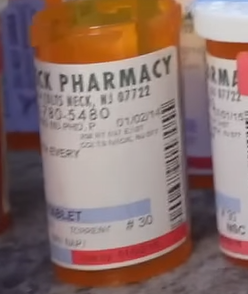
- “Drug Dealers”: No evidence of drug dealing or addiction was presented. Yes, an addictive pain killer was shown in one area, and many pill bottles were on top of a dresser in John’s bedroom. But if you look closely, you can see a variety of dates on the labels, and they generally seem to go back to before Marie’s death. Those two facts, plus the nerve stimulator, plus the medical records suggest that Marie may have been suffering from a painful condition, such as cancer. If so, these drugs would have been cancer treatments or palliative care. John probably just held on to the bottles.
- “Mansion”: While a large house, it is far too small to be called a mansion.
- “arrested for felonies … aggravated assault”: Between the court case and news article cited above, we had a mental-health breakdown, police characterized the surrender as “peaceful”, and no charges were filed as of the arrest. (I don’t know how to reconcile “peaceful” with the use of tear gas, but that’s what the cops said, per the news article.)
Carter’s habit of conveying false information did him a disservice. This was an unusual walkthrough: It had a legitimately interesting backstory! That could have stood on its own. Instead, Carter once again crafts a distorted narrative to sell a walkthrough of left-behind junk in a house about to be ripped down.